What is a Price to Earnings Ratio (P/E Ratio)?
P/E Ratio, also known as the Price To Earnings Ratio, is a calculation that can indicate what the market expects the future earnings of a company to be. A high P/E Ratio likely shows that investors are expecting more future earnings growth than compared to a similar stock with a lower Price To Earnings Ratio. Keep in mind that if it is too high, it may also signal a period of greed or delusion with a particular stock or market. For value investors, it can also help you decide whether a stock is currently expensive or cheap.
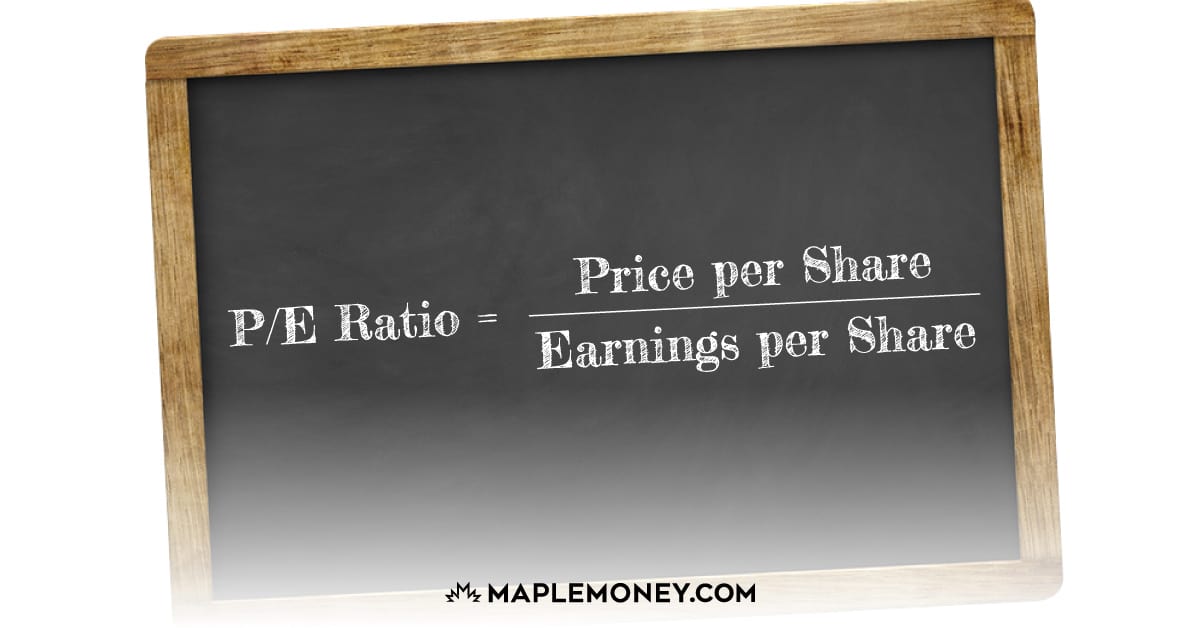
Let’s look at how the P/E Ratio is calculated. This is simply done by taking the current market value of a stock and dividing it by the annual earnings per share. So if a stock is selling for $25 and their earnings per share are $2.00, then the Price To Earnings Ratio is 12.5. This means that the market is willing to pay $12.50 for each dollar of annual earnings.
P/E Ratio = |
____Price Per Share____
|
You can’t simply compare the ratio of a company in the finance sector to another in mining industry. To make this number useful, you need to compare apples to apples. One way to do this is to compare the Price To Earnings Ratio of a stock to the historical ratio of that same stock. Another option is to line up the P/E Ratios of other companies in the same industry. You can also analyze it against the Forward P/E Ratio; that is based on what analysts estimate the next 12 months of earnings will be.
While the Price To Earnings Ratio shows you what value the market as a whole places on a stock, as I mentioned earlier it can also help you find some great bargains in the stock market. You can’t compare stocks on price alone. Maybe you are comparing two stocks in the same sector. One is the $25 example above and another is a $30 stock. Is the $25 stock cheaper? Well it would certainly cost you less money to purchase 100 shares, but that’s not what truly makes it a cheap stock. Not when we find out that the EPS for the $30 stock is $3.00, giving it a P/E Ratio of 10. This means the $30 stock may be a better value since you would be paying less money for each dollar of earnings.
Of course, you should read up on any stocks you are looking to purchase to avoid any unnecessary risk. A low Price To Earnings Ratio may signal a value stock, it may also be a sign of problems with that company. But with the right amount of research, the P/E Ratio can be a helpful tool to narrow down the stocks you are looking at and hopefully find a gem!


Comments
What about the overall P/E of the market? At what point do you look at the TSX 60 and determine that most stocks are over-vlaued, under-valued?
Obviously back in March 2009 there were a lot of under-valued stocks, but still a lot of investors stood on the sidelines in fear of further drops.
Echo, I’m not sure what the historical P/E Ratios have been, I can’t seem to find anything on it. I know I’d like to see the TSX 60 drop below 15, though that might just be me hoping.
Hi Tom,
This is a great explaination of P/E. It is great when filtering stocks to finds those that are under/over valued based on their current price and proven earnings. I think a better indicator of future potential is the PEG ratio. Price to Earnings Growth. This helps you to see if the stock is over/under valued going forward. If the P/E is 6 but the company is losing money the P/E could quickly jump to 12 or 20 or even higher. I always like to filter with the P/E but look at the PEG to determine what the stock might do in the future.
Just my 1frankthought (twitter) 🙂
frankwiginton.com
Comparing prices to ernings is very important, it is easy to get cought in ‘fake’ higher earnings.
Thanks for explaining P/E ratio so clearly and quickly. Understanding that double-edged sword is key — a high ratio can mean great value or greed/delusion, and a low ratio can mean low value or relative stability.